
Business & Productivity school
Certificate in Microsoft Excel
Make Excel calculate, then make it show what it calculated.
This Excel course runs in two halves that work independently: making the spreadsheet calculate, then making it show what it calculated, built in a workbook of your own.
Overview
What this Excel course covers
Most people meet Excel one problem at a time and never see the shape of it. This Excel course teaches the whole shape in two halves that work independently, so you can start wherever your actual problem is and still finish with the complete picture.
The calculating half covers referencing done on purpose, the counting and logic functions, the text and date functions that rescue a badly formatted column, lookups including where XLOOKUP replaces VLOOKUP, then PivotTables, Power Query and a first look at macros. The presenting half runs conditional formatting, charts formatted element by element, dashboards driven by slicers and timelines, maps, and getting the work out of the file without the layout collapsing.
Outcomes
What you will be able to do
Requirements
Course requirements
- Excel recent enough to have dynamic arrays. Type =XLOOKUP( into a cell: if the name completes, you are set.
- The basics already: opening a workbook, typing into cells, formatting them. That gets one lesson here before the pace picks up.
- A workbook of your own with at least fifty rows of real numbers and a column of dates.
- Two questions you would like your data to answer, written down before you start.
Syllabus
Microsoft Excel curriculum
124 recorded video lessons you follow along in the software, at your own pace. Quizzes through each module check what stuck, and a 20-question final exam earns your certificate.
1Excel Formulas and Functions Foundations6 lessons · 5 videos · quiz
- Course Welcome (reading)
- Course Overview and Learning Expectations (video lesson, 2 minutes 34 seconds)
- Course Walkthrough and Sample Data Overview (video lesson, 16 minutes 54 seconds)
- Understanding Functions and Formulas (video lesson, 4 minutes 50 seconds)
- Understanding Common Excel Errors (video lesson, 5 minutes 41 seconds)
- Understanding Cell Referencing (video lesson, 42 minutes 12 seconds)Quiz
2Mathematical and Logical Functions3 lessons · 3 videos · quiz
- Using Math Functions (video lesson, 25 minutes 45 seconds)
- Using Logical Functions (video lesson, 4 minutes 28 seconds)
- Combining Math and Logical Functions (video lesson, 22 minutes 35 seconds)Quiz
3Text, Date and Time Functions2 lessons · 2 videos · quiz
- Extracting, Combining and Formatting Text (video lesson, 25 minutes 32 seconds)
- Using Date and Time Functions (video lesson, 36 minutes 10 seconds)Quiz
4Lookup and Reference Functions5 lessons · 5 videos · quiz
- Comparing OFFSET and INDEX Functions (video lesson, 12 minutes 4 seconds)
- Using the FILTER Function (video lesson, 7 minutes 5 seconds)
- Comparing VLOOKUP, HLOOKUP and XLOOKUP (video lesson, 14 minutes 39 seconds)
- Lookup and Reference Functions Review (video lesson, 53 minutes 51 seconds)
- Working with Excel Table Functionality (video lesson, 38 minutes 39 seconds)Quiz
5Error Handling, Data Analysis and Aggregation6 lessons · 6 videos · quiz
- Introduction to Error Handling and Detection Functions (video lesson, 8 minutes 45 seconds)
- Practicing Error Handling and Detection Functions (video lesson, 12 minutes 53 seconds)
- Introduction to Data Analysis in Excel (video lesson, 7 minutes 22 seconds)
- Data Analysis Practice (video lesson, 28 minutes 59 seconds)
- PivotTable Essentials and PivotCharts (video lesson, 29 minutes 10 seconds)
- Using GETPIVOTDATA and Dynamic Arrays (video lesson, 23 minutes 26 seconds)Quiz
6Advanced Excel Tools, Automation and Dashboards8 lessons · 8 videos · quiz
- Using Named Ranges (video lesson, 17 minutes 12 seconds)
- Using Named Ranges and Dynamic Print Areas (video lesson, 14 minutes 21 seconds)
- Introduction to Power Query (video lesson, 19 minutes 16 seconds)
- Introduction to VBA Macros (video lesson, 26 minutes 41 seconds)
- Dashboard Preview and Build Part 1 (video lesson, 15 minutes 19 seconds)
- Dashboard Preview and Build Part 2 (video lesson, 26 minutes 54 seconds)
- Using Excel Copilot for Microsoft 365 (video lesson, 29 minutes 34 seconds)
- Formulas and Functions Section Wrap-Up (video lesson, 37 seconds)Quiz
7Excel Data Visualization Foundations2 lessons · 2 videos · quiz
- Welcome to Excel Data Visualization (video lesson, 36 seconds)
- Data Visualization Course Overview (video lesson, 3 minutes 7 seconds)Quiz
8Table-Based Data Visualization9 lessons · 9 videos · quiz
- Introduction to Conditional Formatting (video lesson, 7 minutes 53 seconds)
- Using Highlight Cell Rules (video lesson, 19 minutes 8 seconds)
- Using Top and Bottom Rules (video lesson, 9 minutes 53 seconds)
- Using Data Bars (video lesson, 4 minutes 58 seconds)
- Using Color Scales (video lesson, 3 minutes 43 seconds)
- Using Icon Sets (video lesson, 4 minutes 22 seconds)
- Creating, Clearing and Managing Conditional Formatting Rules (video lesson, 8 minutes 45 seconds)
- Conditional Formatting Review (video lesson, 7 minutes 19 seconds)
- Practice Project A: Academic Report Visualization (video lesson, 26 minutes 19 seconds)Quiz
9Charts, Graphs and Visual Representation6 lessons · 6 videos · quiz
- Introduction to Charts and Graphs (video lesson, 7 minutes 40 seconds)
- Comparing Tables, Charts and Graphs (video lesson, 16 minutes 32 seconds)
- Using Sparklines (video lesson, 21 minutes 37 seconds)
- Creating Mini Charts (video lesson, 11 minutes 45 seconds)
- Charts and Graphs Review (video lesson, 5 minutes 43 seconds)
- Practice Project B: Gantt Chart (video lesson, 26 minutes 13 seconds)Quiz
10Chart Formatting and Customization18 lessons · 18 videos · 2 quizzes
- Understanding the Purpose of Chart Customization (video lesson, 9 minutes 7 seconds)
- Formatting the Chart Area (video lesson, 7 minutes 11 seconds)
- Formatting the Plot Area (video lesson, 4 minutes 39 seconds)Quiz
- Formatting Chart Axes (video lesson, 13 minutes 15 seconds)
- Adding and Formatting Axis Titles (video lesson, 6 minutes 37 seconds)
- Adding and Formatting Chart Titles (video lesson, 4 minutes 1 second)
- Adding and Formatting Data Labels (video lesson, 8 minutes 1 second)
- Adding Data Tables to Charts (video lesson, 6 minutes 31 seconds)
- Adding and Formatting Error Bars (video lesson, 13 minutes 12 seconds)
- Formatting Gridlines (video lesson, 5 minutes 38 seconds)
- Formatting Chart Legends (video lesson, 8 minutes 33 seconds)
- Adding and Formatting Trendlines (video lesson, 9 minutes 24 seconds)
- Changing Chart Styles (video lesson, 4 minutes 19 seconds)
- Changing Chart Colors (video lesson, 2 minutes 56 seconds)
- Managing Chart Data Sources (video lesson, 8 minutes 19 seconds)
- Managing Chart Data Series (video lesson, 6 minutes 8 seconds)
- Chart Customization Review (video lesson, 10 minutes 19 seconds)
- Quick Quiz A: Chart Customization (video lesson, 9 minutes 58 seconds)Quiz
11Essential Excel Charts and Graphs8 lessons · 8 videos · 2 quizzes
- Using Column and Bar Charts for Comparisons (video lesson, 30 minutes 57 seconds)
- Using Line and Area Charts for Trends (video lesson, 24 minutes 12 seconds)Quiz
- Using Pie and Doughnut Charts for Proportions (video lesson, 22 minutes 4 seconds)
- Using Scatter and Bubble Charts for Relationships (video lesson, 29 minutes 30 seconds)
- Using Histograms and Box and Whisker Charts (video lesson, 30 minutes 34 seconds)
- Using Treemap and Sunburst Charts for Hierarchies (video lesson, 29 minutes 11 seconds)
- Essential Charts and Graphs Review (video lesson, 15 minutes 54 seconds)
- Practice Project C: Daily Activity Tracker (video lesson, 36 minutes 53 seconds)Quiz
12Specialised Excel Charts and Graphs8 lessons · 8 videos · 2 quizzes
- Using Combo Charts for Mixed Data (video lesson, 25 minutes 39 seconds)
- Creating Waterfall Charts (video lesson, 15 minutes 43 seconds)
- Creating Funnel Charts (video lesson, 21 minutes 33 seconds)
- Creating Stock Charts (video lesson, 18 minutes 3 seconds)
- Creating Surface Charts (video lesson, 17 minutes 15 seconds)Quiz
- Creating Radar Charts (video lesson, 11 minutes 41 seconds)
- Specialised Charts and Graphs Review (video lesson, 16 minutes 50 seconds)
- Quick Quiz B: Specialised Charts (video lesson, 10 minutes 17 seconds)Quiz
13Choosing Effective Visualizations4 lessons · 4 videos · 2 quizzes
- Choosing the Right Conditional Formatting Rules (video lesson, 17 minutes 30 seconds)
- Choosing the Right Charts for Your Data (video lesson, 14 minutes 25 seconds)Quiz
- Visualization Selection Review (video lesson, 5 minutes 53 seconds)
- Quick Quiz C: Choosing Visualizations (video lesson, 9 minutes 45 seconds)Quiz
14Excel Dashboard Design8 lessons · 8 videos · 2 quizzes
- Understanding Excel Dashboard Concepts (video lesson, 7 minutes 32 seconds)
- Using PivotTables in Dashboards (video lesson, 13 minutes 37 seconds)
- Using PivotCharts in Dashboards (video lesson, 7 minutes 59 seconds)Quiz
- Using Slicers and Timelines (video lesson, 11 minutes 51 seconds)
- Making Dashboard Design Decisions (video lesson, 6 minutes)
- Dashboard Design Review (video lesson, 10 minutes 43 seconds)
- Practice Project D: KPI Dashboard (video lesson, 30 minutes 46 seconds)
- Practice Project E: Investment Dashboard (video lesson, 44 minutes 39 seconds)Quiz
15Map-Based Data Visualization in Excel4 lessons · 4 videos · quiz
- Creating 2D and Filled Maps (video lesson, 16 minutes 22 seconds)
- Creating 3D Maps (video lesson, 48 minutes 28 seconds)
- Map Visualization Review (video lesson, 10 minutes 53 seconds)
- Quick Quiz D: Excel Maps (video lesson, 9 minutes 50 seconds)Quiz
16Excel Visualization Add-Ins11 lessons · 11 videos · 2 quizzes
- Managing Add-In Permissions (video lesson, 6 minutes 59 seconds)
- Using the Bing Maps Add-In (video lesson, 5 minutes 20 seconds)Quiz
- Using the Visio Data Visualizer Add-In (video lesson, 13 minutes 53 seconds)
- Using the People Graph Add-In (video lesson, 7 minutes 1 second)
- Using the QR4 Office Add-In (video lesson, 9 minutes 32 seconds)
- Using the Mini Calendar and Date Picker Add-In (video lesson, 12 minutes)
- Using the Web Video Player Add-In (video lesson, 10 minutes 22 seconds)
- Using the Colorizer Add-In (video lesson, 10 minutes 54 seconds)
- Using the Places Add-In (video lesson, 6 minutes 26 seconds)
- Excel Add-Ins Review (video lesson, 16 minutes 56 seconds)
- Quick Quiz E: Excel Add-Ins (video lesson, 9 minutes 55 seconds)Quiz
17Managing, Presenting and Exporting Excel Visualizations17 lessons · 17 videos · quiz
- Understanding the Full Visualization Workflow (video lesson, 4 minutes 49 seconds)
- Using Cell References in Visualization Workflows (video lesson, 10 minutes 3 seconds)
- Naming Cells for Better Workbook Management (video lesson, 7 minutes 48 seconds)
- Adjusting Cell Width and Height (video lesson, 4 minutes 48 seconds)
- Freezing and Splitting Panes (video lesson, 10 minutes 2 seconds)Quiz
- Grouping Data in Excel (video lesson, 9 minutes 27 seconds)
- Creating Drop-Down Lists (video lesson, 9 minutes 30 seconds)
- Adjusting Chart Location and Position (video lesson, 9 minutes 10 seconds)
- Managing Chart and Cell Connections (video lesson, 8 minutes 1 second)
- Switching Workbook Views (video lesson, 5 minutes 11 seconds)
- Linking Data Between Sheets (video lesson, 5 minutes 50 seconds)
- Configuring Printing Options (video lesson, 21 minutes 19 seconds)
- Sharing Excel Workbooks (video lesson, 7 minutes 20 seconds)
- Exporting Excel Reports and Visualizations (video lesson, 9 minutes 21 seconds)
- Final Visualization Workflow Review (video lesson, 8 minutes 1 second)
- Practice Project F: Web Analytics Report (video lesson, 8 minutes 26 seconds)
- Quick Quiz F: Managing and Presenting Visualizations (video lesson, 5 minutes 46 seconds)
Certificate
Earn a certificate you can show
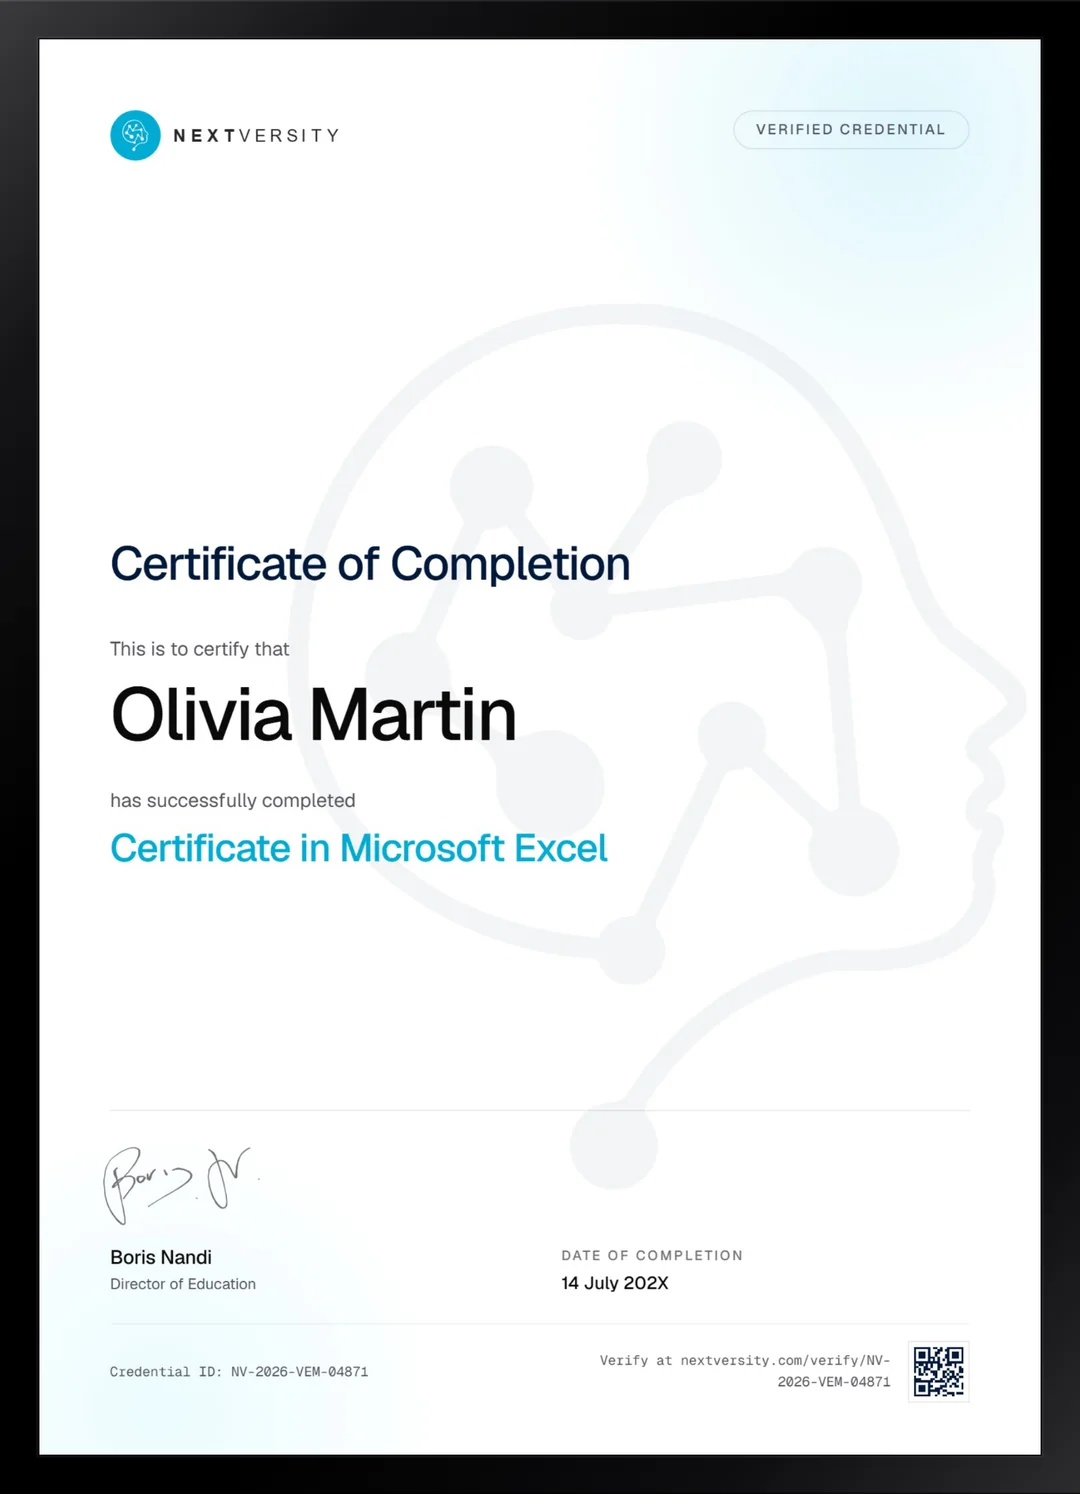
Finish the final module and your Microsoft Excel certificate is issued automatically. Download it, share it with employers and clients, or add it to your resume and LinkedIn.
Where this can take you
Skills from this school show up in roles like these. The certificate proves you finished; the projects you build are what get you hired.
- Operations coordinator
- Project coordinator
- Data and reporting analyst
- Executive assistant
- Freelancer on Fiverr or Upwork
Enroll with confidence
Enroll with confidence
Full details in the refund policy. One subscription covers this course and every other course in all 8 schools.
Pair it with
More from the Business & Productivity school
 Intro
IntroSpreadsheets from the very start: cells, formatting, formulas and functions, then charts and two builds from a blank sheet.
96 lessonsSelf-pacedCertificate
 Certificate
PivotTables, Power Query, Power Pivot and dynamic arrays on one dataset, then VBA to make it run itself.
77 lessonsSelf-pacedCertificate
FAQ
Common questions about the Excel course
Is this Excel course good for beginners?
It assumes you can already open a workbook, type into cells and format them. If that describes you, the course starts exactly where you are. If the formula bar itself is unfamiliar, take the Introduction to Microsoft Excel first: it spends its whole run on the ground this course covers in a single lesson.
Does the course cover PivotTables and dashboards?
Yes, both, and they are the spine of the second half. PivotTables arrive in the lookup and analysis stretch, then come back for two dashboard projects driven by slicers and timelines. A dashboard somebody else can use without asking you questions is one of the most immediately valuable things you can build at work.
Do I need Microsoft 365, or will an older Excel work?
An older Excel works for most of it. The exception is dynamic arrays and XLOOKUP, which need a recent build. Type =XLOOKUP( into an empty cell to check: if the name completes, the lookup module matches what you see. If it does not, INDEX and MATCH cover the same ground and are taught here anyway.
How long does the Excel course take to finish?
Budget roughly 25 to 35 hours if you build alongside the lessons, which is the only version worth taking. It is fully self-paced with no deadlines. Because the two halves are independent, plenty of people do the half they need now and come back for the other one months later.
Can I skip straight to the charts and dashboards?
Yes. The visualization half does not depend on the formula half, so if you came for conditional formatting, charts, dashboards and maps you can start there without missing anything. The certificate needs every lesson complete, but the order you work in is entirely your own.
Should I take this or the Excel data analysis course?
Take this one if you want Excel broadly, calculating and presenting both. Take Excel Data Analysis if analysis is already your job and you want Power Query, Power Pivot, forecasting and VBA automation in depth. They overlap less than the names suggest, and both come with the same subscription.
Is there an Excel certificate at the end?
Yes. Each module ends with a quiz at a 75% pass mark that never blocks your progress, and the course ends with a twenty-question final exam drawn from both halves. Passing issues a certificate with a verification code and a public link. It is not a Microsoft credential and does not claim to be.
Free info pack
Not ready to enroll? Start with the guide.
The full curriculum for this course, what you'll build, and how it fits with the rest of the school, in one short guide.